

How I vibe-coded a Figma plugin (w/ 0 coding skills) that cut APM Tracing design time at Datadog

Why Did I Build It?
Designing for Datadog APM tracing is challenging. Beyond solving complex problems, creating a realistic trace view (waterfall view) in Figma is a tedious, time-consuming task because there’s no dynamic, reusable component. As a product designer with limited coding skills, building these views by hand was always a necessary step before starting any new feature.
Our entire team faced this same struggle. Without a shared template, whenever we worked on APM tracing integrations, designers spent hours repeatedly building waterfall views from scratch to fit each project’s needs.
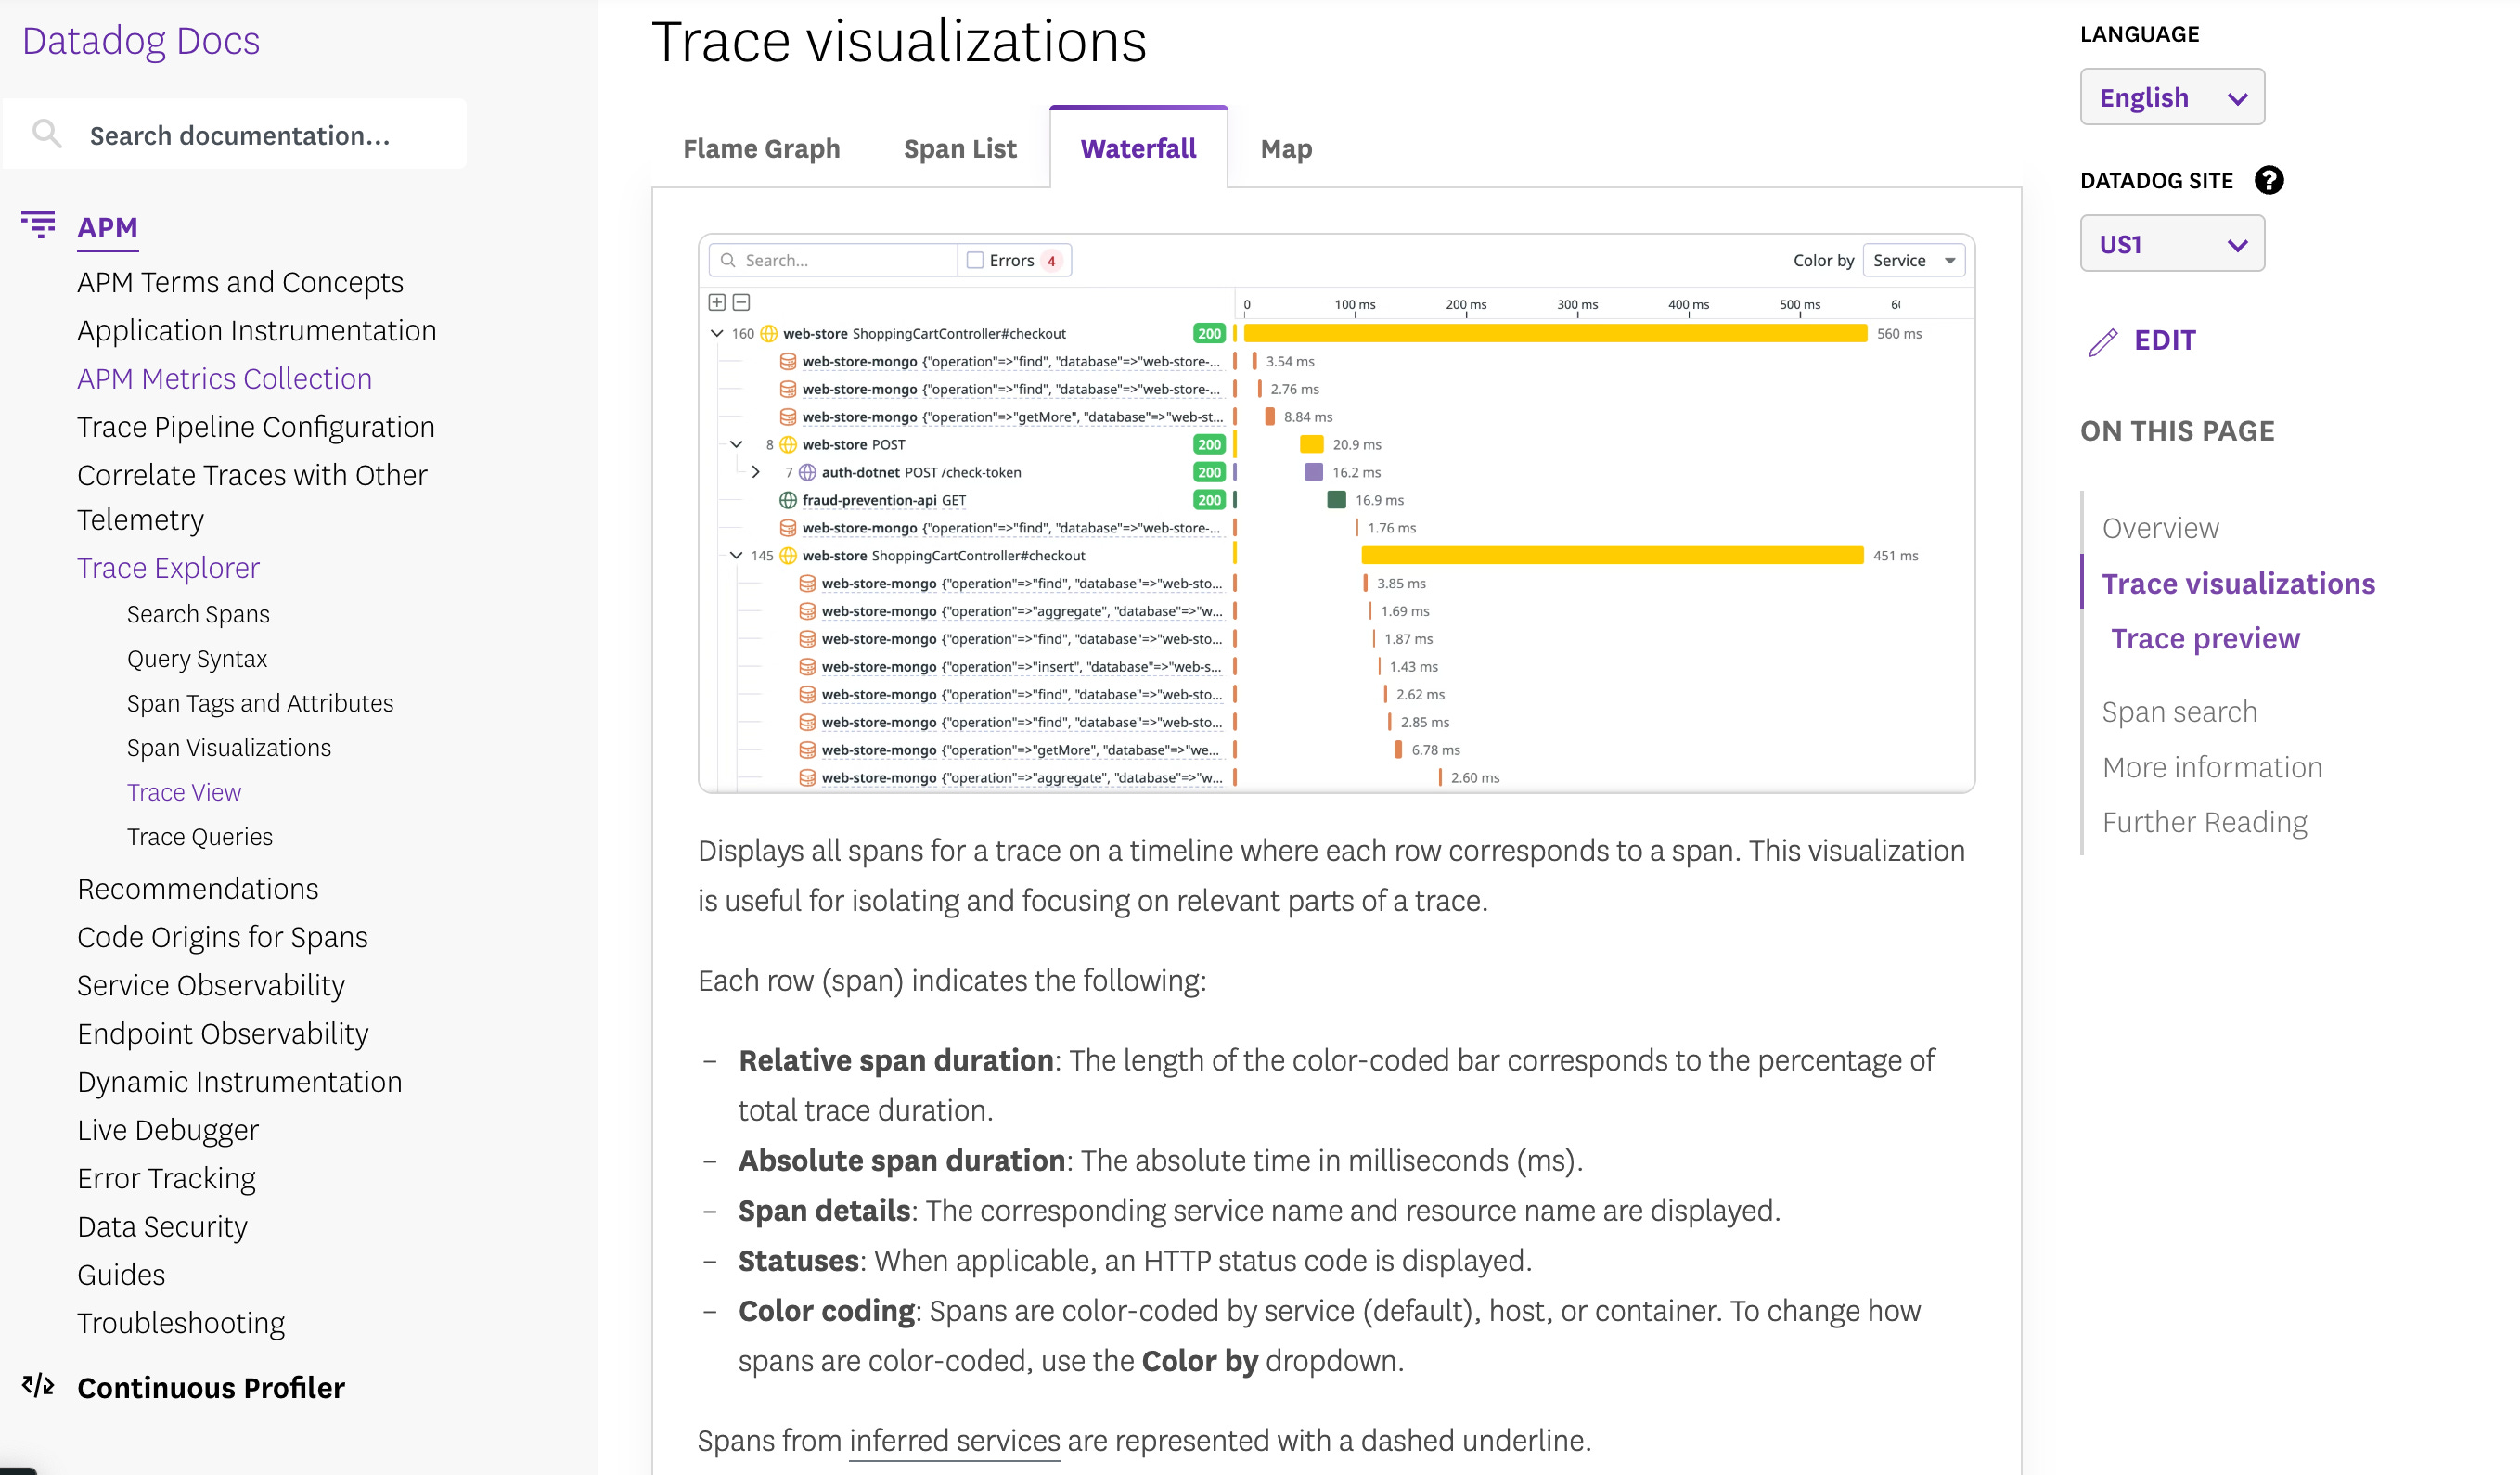
(https://docs.datadoghq.com/tracing/trace_explorer/trace_view/?tab=waterfall)
Goal
Two weeks ago, when I finally had some spare time, I decided to build a Figma plugin that would:
Let designers control the size of the trace and choose key details to display
Instantly generate a realistic, editable, on-brand trace view
Save everyone hours by eliminating the need to build trace waterfall views by hand
Results
Time saved: What once took hours now takes seconds
Impact: The plugin is open for over 100 designers at Datadog
Flexibility: Anyone can create custom trace views without relying on engineering or tedious manual design
Process
Tools and Setup
Cursor: Did all the coding work for me since I don’t know how to code
YouTube Tutorials: For learning the Figma plugin basics
ChatGPT: Optional AI assistant (I used it less than five times throughout the process)
Breaking Down the Project
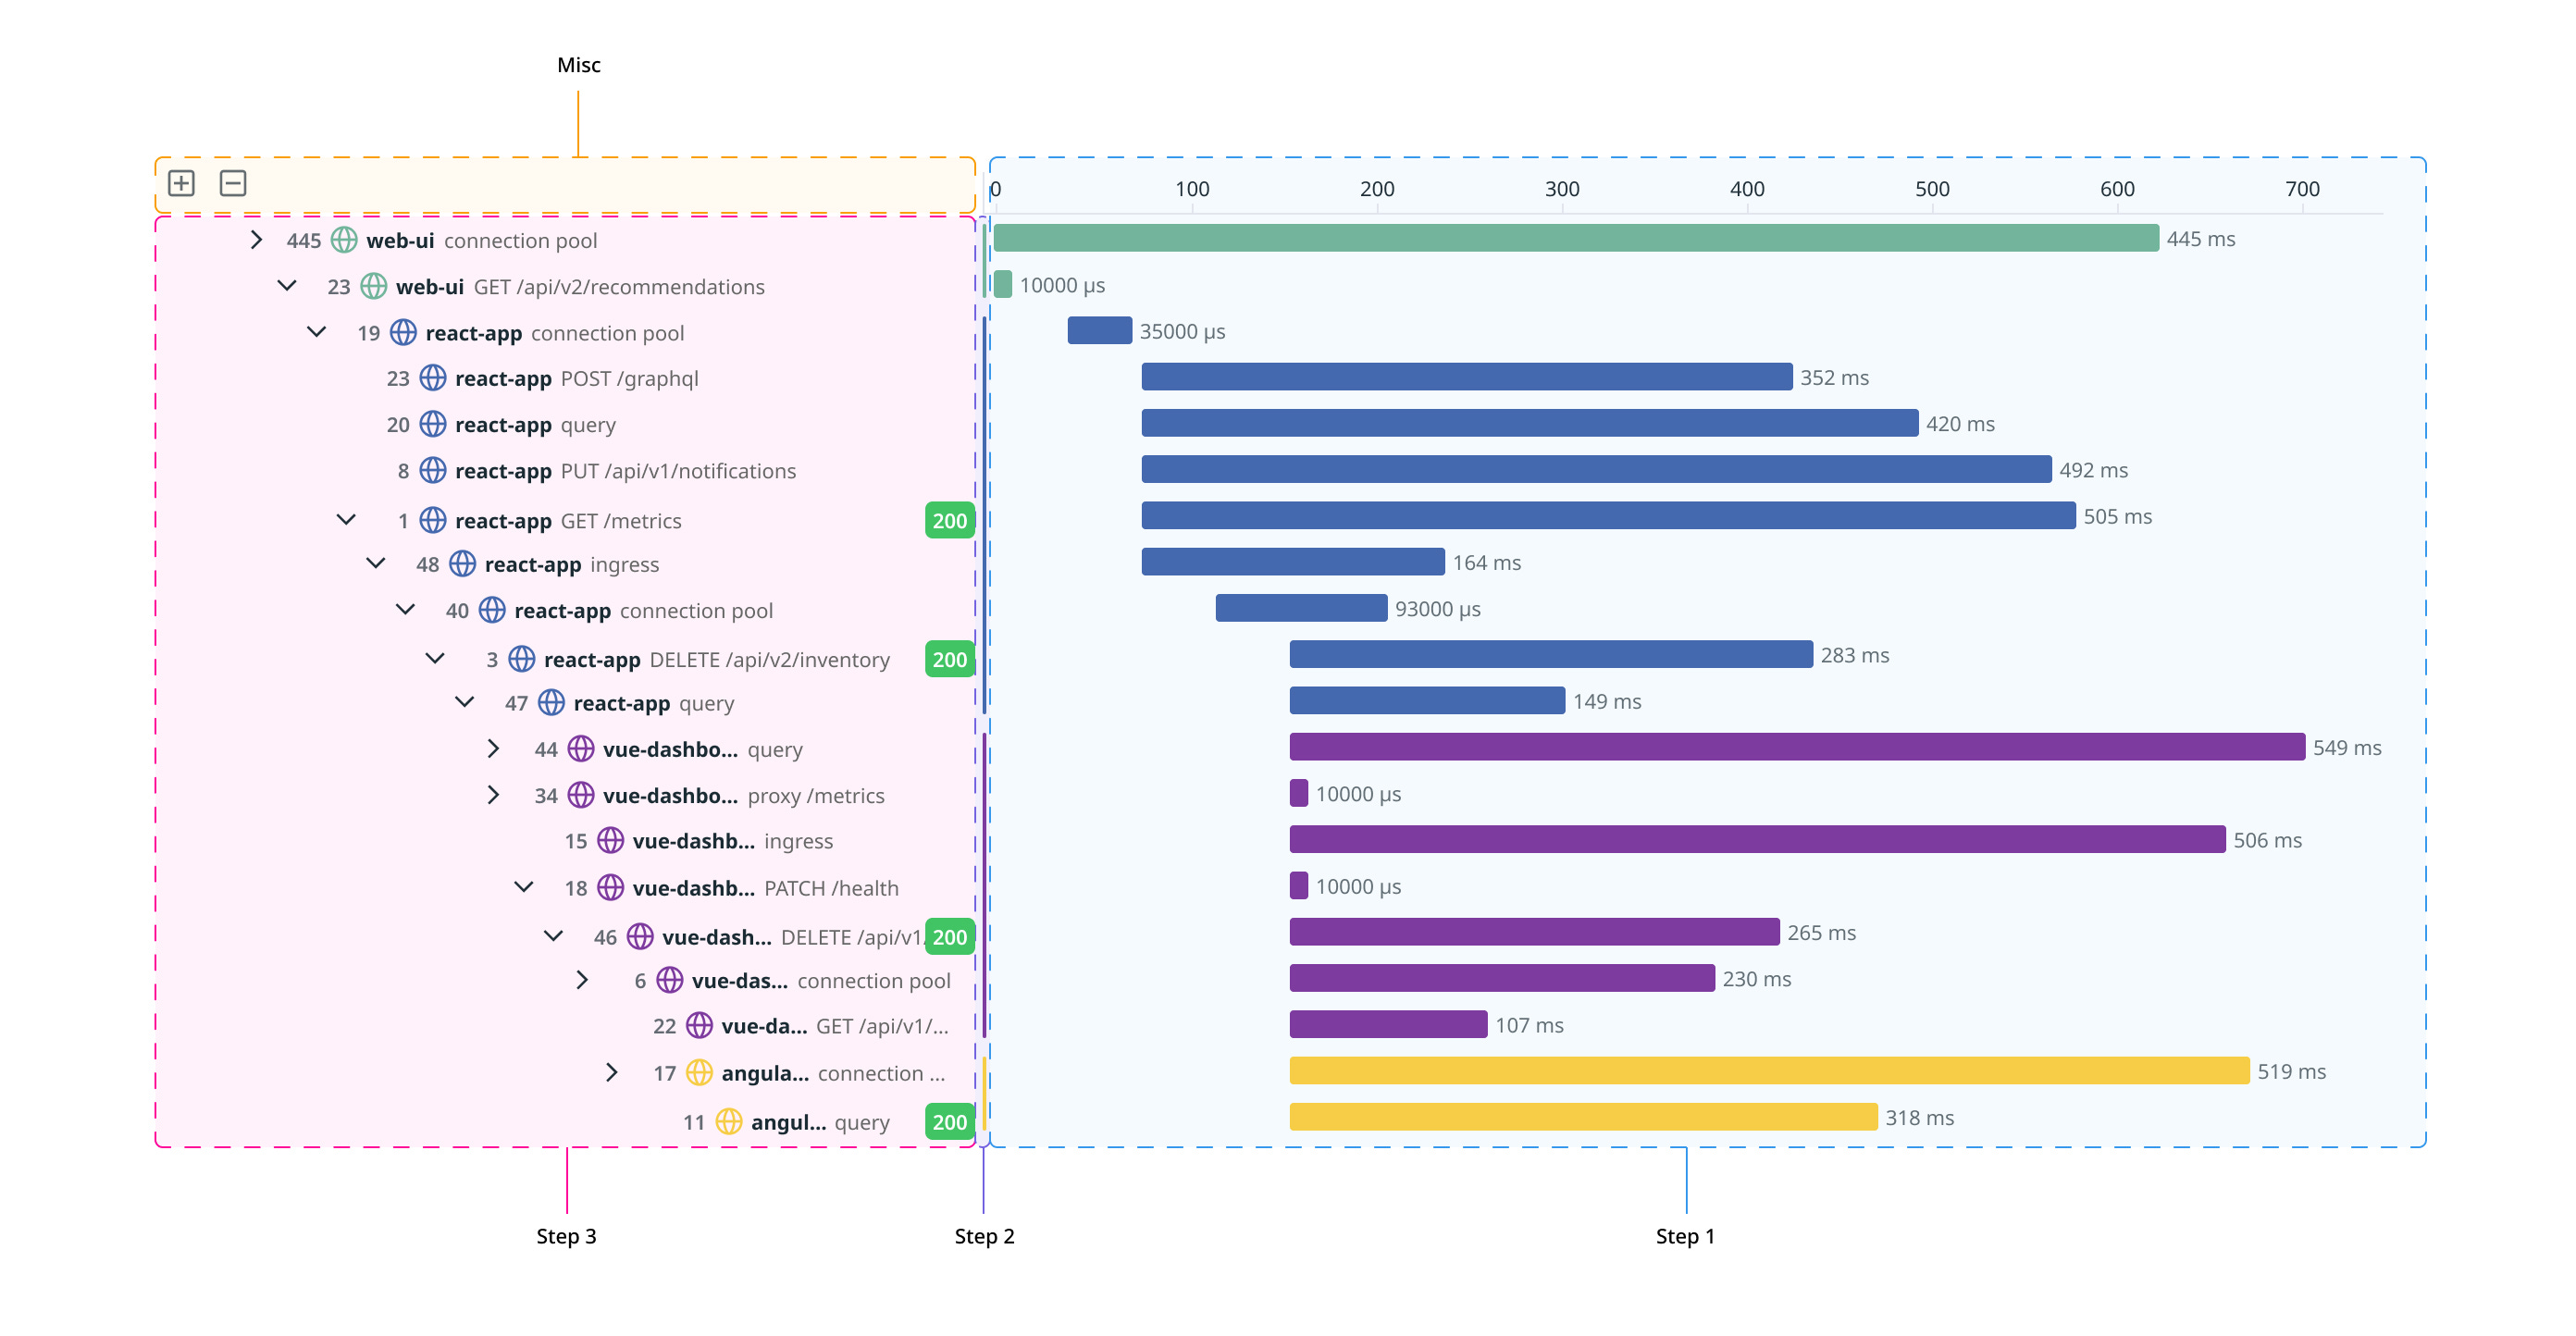
Instead of trying to build the Waterfall Generator plugin all at once, I made a list of the key elements in a Datadog waterfall view:
The left side: a tree structure with icons and nested labels
The middle section: colored markers indicating groups
The right side: a timeline where each span shows service durations
I started with what felt simplest, which for me was the timeline on the right.
a) Making the Timeline
I exported a real trace timeline as an SVG and gave it to Cursor. I specified exactly what padding, height, and colors to use. After a few tries, it recreated the layout almost perfectly.
b) Adding Colored Markers
Next, I focused on the vertical bars in the middle. I matched the group colors to the real Datad
og palette by sampling from their frontend code. I set a rule that each group’s vertical marker should match its corresponding timeline bar in both color and height.
c) Solving the Tree View
This was the hardest part. My first attempts failed because I tried to do too much at once. So I simplified:
Started by describing just a single row:
Collapse/expand arrow (using SVG icons)
A random number as a status
A service type icon (like Globe or Database)
Service name and resource name, all laid out in one line
Once that worked, I gradually added indentation rules for nesting so parent and child relationships appeared clearly.
Example prompt:
Each line should always starts with a collapse/open arrow. Attached the icon, find AngleRight and AngleDown. Size 16*16 arrange randomly on each line 3. The second item is number, display randomly from 1 to 50 font Noto Sans Semibold, weight 600, size 11px, color #1C2B344 4.Then the third item is service type icon, use Globe, Database, Desktop, and CogMulti icons from the figma file i shared 5. Service name is the next item, use random back and front end service names such as web-ui, ingress-haproxy-api, etc, all low case, noto sans bold, weight 700, size 11 px 6. Resource name is after the service name, use random web dev resource names such as /api/ui/metric/search, ingress, async envoy.service.auth.v3.Authorization 7. each row is 10 px high, max width 466 px
d) Adding Randomness With Conditions
The goal was to make each design look “realistic,” not obviously fake. I let Cursor randomize details like bar start/end, service names, and resource names—but only within the rules I set.
e) Simple, Focused Controls
For the plugin’s UI, I kept it basic:
Number of rows (to control trace length)
Status (for quick variety)
This made the plugin fast to use and easy for anyone to pick up.
Iterating and Solving Errors
I faced a lot of errors and dead ends. The key was breaking down every problem into smaller steps and only fixing one thing at a time. If something failed, I simply copied the error message and asked Cursor for help.
What Helped Most
The PM mindset of what’s in my MVP:
I constantly asked myself what was the smallest set of features that would make the plugin genuinely useful, so I didn’t get sidetracked or overbuild.
Focus on making every step as small and clear as possible:
Breaking big problems into tiny, manageable tasks made progress steady and troubleshooting much easier, since I could always revert just the last step.
If you’re working with SVG files as references, break them down too—for example, I split the waterfall view into three sections, and then divided the tree view into single lines before building it up.
Use AI and automation for tasks that repeat:
Leveraging AI tools and automating repetitive steps made the process much faster and reduced errors; I let Cursor run and test each step, making sure each piece worked before moving forward.